
This article is a guide for decision-making tools and techniques. It offers a variety of types, diagrams, group decision-making processes and models. And all of them are applicable in many business areas as finance, trading, and project management.
The main sections are:
Basics
Non-monetary decision-making tools and techniques
Monetary decision-making techniques
General diagram
Software
Group techniques
Problem-solving
Basics
Ok, we need a little bit of theory. Decisions do not come in one second. There are some general steps.
Define problem or opportunity – usually we find a beneficial opportunity we’d like to achieve or a negative issue we’d like to avoid. They come from many sources in one company and we have many of them in our day-to-day job usually. General techniques here are to keep track of the major risk and best opportunities you have.
Gather information – so we have some information which we need to keep in mind. It can be internal corporate culture or external legal requirements.
Define alternative solutions – this process can be individual or group. More about the group decision-making technique here. Individual definition of alternatives usually needs analytical skills.
Verify selection criteria – first keep in touch with company’s vision and mission, follow the strategic plan /to the point you have information/, align with the road map, check KPIs, bear in mind for impacted stakeholders’ interests.
Evaluate and select alternative solution – this is the big one. This article is mainly about the process of evaluating alternative solutions and selecting it.
Act and follow up – obviously, you need to act as decided and to check what is the impact of the implemented decisions.
Non-monetary decision-making tools and techniques
There are some decision-making tools and techniques which can help you to select alternatives based on their qualities without taking into consideration pure monetary impact.
Pareto diagram
One of the simple methods especially if we need to fix issues and find beneficial opportunities fast. Pareto diagram decision-making technique is based on 80/20 rules (80% of issues or opportunities come from 20 % causes). So defining what cause most issues/benefits could be crucial.
Example – we are a software company and need to decide how to improve our products. For that reason, we make questionnaire survey with our customers. The results go into Pareto diagram.
What do you see on the Pareto chart?
Obviously, the performance is poor and we need to improve it.
Bugs are an issue also.
But the system is usable, not overpriced and with a good support team.
So Pareto chart supports taking the decision to improve performance.
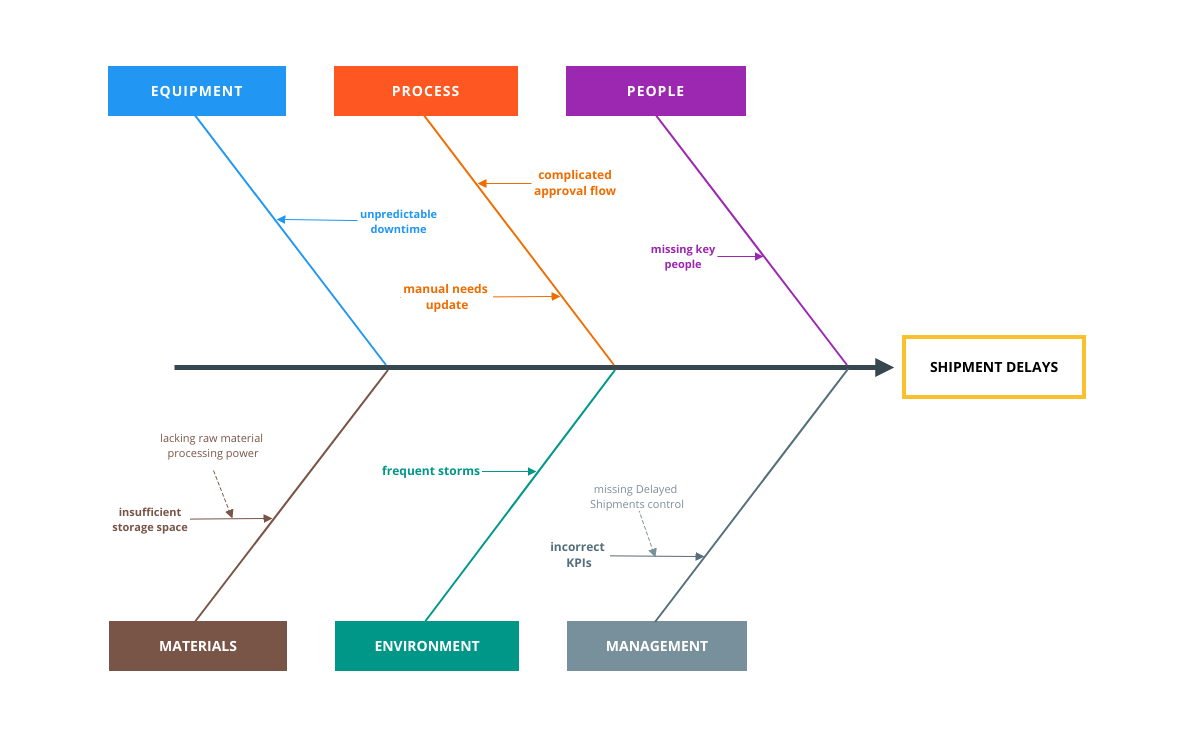
Cause-and-effect diagram
One of the best decision-making tools is called cause-and-effect diagram, also known as fishbone diagram or Ishikawa diagram.
It is a great technique for investigating the exact cause of an issue.
The fishbone of the diagram can vary each time. But there are some typical types of bones depending on your business.
Big five M in industry or IT:
Machine or technology
Method or process
Material – consumables or information
Man Power – physical work or Mind Power (brain work)
Measurement
Big 8 in marketing and sales – Product/Service, Price, Place, Promotion, People/personnel, Process, Physical Evidence, Publicity.
As you can see the Ishikawa diagram is great decision-making techniques in many, many business areas.
Control Chart
This is an interesting decision-making tool.
You can use control chart in order to decide if a process in within the predefined range.
And if the process is out of control the management should investigate and find a solution.
As you can see control chart has an upper limit, down limit and mean. On the diagram, we have an example of a process within a range.

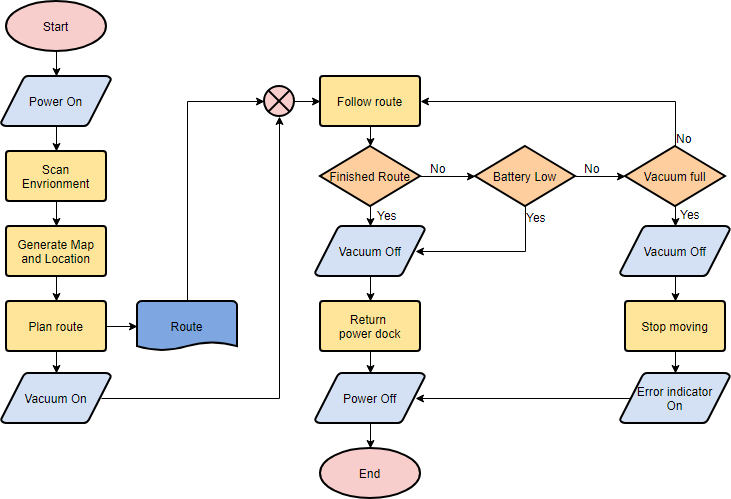
Flowcharts
One of the most popular decision-making techniques is creating a flowchart.
The flowcharts really shine when you have a process with steps and decisions in it.
These diagrams really help to define all the decisions which will be made in a process and their consequences.
The most important entities in flowcharts are the start, steps, decisions, exceptions, end.
Flowcharting helps in many areas – project management, business analysis, industry, trade, etc.
Scatter Diagram
Another useful decision-making tool is called Scatter diagram (or Scatter chart).
This diagram displays relations between 2 variables. Which can really help the decision-making process.
On a diagram example, you see that a little change of Variable 1 leads to a massive change to Variable 2.
It can be a risk, it can be an opportunity but in any case, the scatter diagram will be a useful technique for supporting decisions.
There are many different options for scatter diagrams – point relationship, trends, 3D scatter chart, and etc.

Statistical Sampling
One of the basic decision-making tools and technique, especially if it comes for go/not go decisions for a new product.
The technique is simple, an inspector selects a predefined subset of materials, products, customers and investigates if they matched the required quality/satisfaction.
There are many different types of statistical sampling but most important ones are probability vs non-probability sampling.
Probability statistical sampling – each one of the evaluated products/customers can be selected for a test.
Non-probability statistical sampling – not all of the – each one of the evaluated products/customers can be selected for a test. Some of them are excluded from sampling.
Sampling methods have some disadvantages because not all of the entities are checked but they can provide fast information for quality and products/customers readiness. Monetary decision-making techniques.
Monetary decision-making techniques
We all live a material world so making decisions based on their monetary impact is something normal. There are many monetary-based decision-making tools and techniques and here I will explain the most popular of them.
Benefit/Cost Ratio
If you need to make a decision and you have some alternatives, the most simple and fast way for monetary selection is benefit/cost ratio.
You simply calculate the benefits and divide them into calculated costs. You have a coefficient for each alternative and you can select the highest coefficient.
There are some disadvantages with benefit/cost ratio methods. First – it is not so easy to calculate the correct amount for benefits and costs. Second – you do not calculate indirect benefits as customer satisfaction.

Weighted Scoring Models
If you need to evaluate alternatives based on many criteria the best decision-making tools you can use is weighted scoring models.
You need to follow the next steps:
Define alternatives
Define criteria for evaluation
Evaluate the weight of criteria in percentage
Assign scores for each criterion
Calculate the score
The weighted scoring model is an excellent technique when you need to select vendor’s proposal. And when you need to defend a decision to the high management. As a downside, it is time-consuming.
Payback Period
One simple but powerful technique. It is a simple calculation if you choose an alternative X and invest Y amount of money when you are going to have your money back.
The formula is Payback Period = Cost of Project / Annual Cash Inflows.
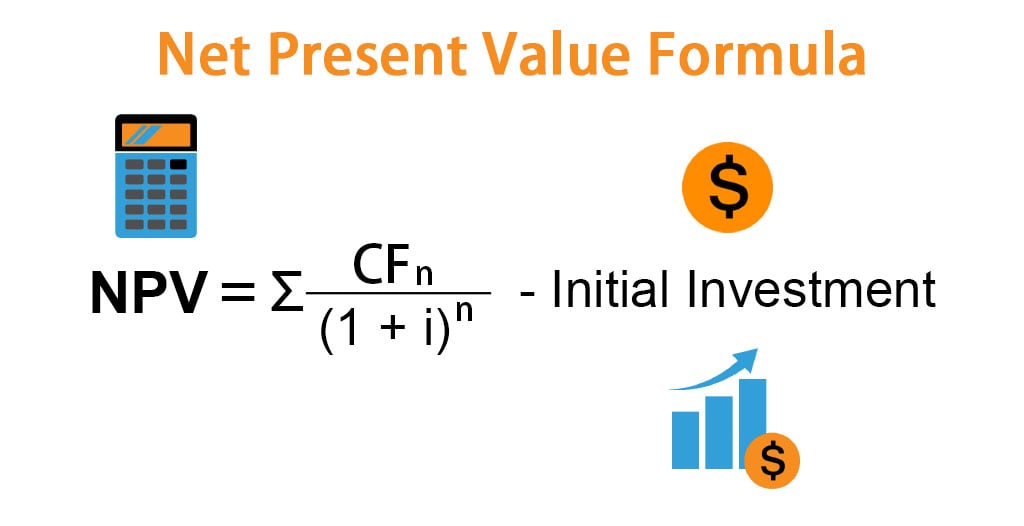
Net Present Value
One of the most important decision-making technique in case you have long lasting alternatives.
We all know that one dollar now is more than one dollar in the future. So Net Present value calculates what is the current value of the future income or expense.
So if you have alternatives that last more than one year Net Present Value comes handy.
I will try to explain the calculation as simple as possible with one example.
If we have 2 alternatives:
Alternatives | Current investment | Income year 1 | Income year 2 | Income year 3 |
Alternative 1 | 50 000 | 20 000 | 20 000 | 20 000 |
Alternative 2 | 50 000 | 10 000 | 30 000 | 10 000 |
Discount rate/inflation is 5% and we get payment in the beginning of each period.
So first we need to calculate the net present value of income year 2 and year 3.
The formula for calculating Net Present value for one period is:
Alternative 1, year 2 we have = 20 000 / (1+ 0.05) = 20000/1,05 =19 047 USD
Alternative 1, year 23we have = 20 000 / (1+ 0.05)*(1+ 0,05)= 20000/1,1025 =18 140 USD
Net Present value Alternative 1 = 20000 + 19 047 + 18 140 = 57 187 USD
Alternative 2, year 2 we have = 30 000 / (1+ 0.05) = 20000/1,05 =28 571 USD
Alternative 1, year 23we have = 10 000 / (1+ 0.05)*(1+ 0,05)= 20000/1,1025 =9 070 USD
Net Present value Alternative 1 = 20000 + 28 571 + 9 070= 57 821 USD
Obviosly, Alternative 2 is more profitable based on Net Present Value technique.
I will not go deeper into financial calculation since this is not the purpose of the article. You can find here additional information about other monetary coefficients as Internal Rate of Return and Discounted Cash Flow.
........................................
* Quý phụ huynh và các bạn học sinh quan tâm và cần tư vấn thêm thông tin chi tiết liên quan đến tâm lý, hướng nghiệp, du học các nước, học bổng, visa,... Xin vui lòng để lại thông tin bên dưới. Các chuyên viên của KEYSKILLS sẽ liên hệ lại với quý khách trong thời gian sớm nhất.
*Địa chỉ: Lầu 5, 74C Nguyễn Văn Cừ, P.Nguyễn Cư Trinh, Quận 1
*Hotline: 096 269 1068 - 086 611 6068 (zalo/viber)
*Fanpage: KeySkills ; English for Career; Ba mẹ ơi, con chọn nghề gì? ; Cha mẹ đồng hành cùng con chọn nghề tương lai
Đăng ký tư vấn
Bài Viết Mới Nhất

200 TỪ VỰNG TIẾNG ANH THÔNG DỤNG CHUYÊN NGÀNH BẾP BÁNH
04 Tháng 11, 2022
")
Top những trường đào tạo Animation tốt nhất trên thế giới (Phần 2)
10 Tháng 11, 2020
")
Top những trường đào tạo Animation tốt nhất trên thế giới (Phần 1)
06 Tháng 11, 2020

Landscape Architect vs. Landscape Designer: What's the Difference?
29 Tháng 10, 2020

What Is Interior Decorating?
28 Tháng 10, 2020

What is a Landscape Architect?
28 Tháng 10, 2020

Interior Design vs. Interior Decorating
28 Tháng 10, 2020

How to Become an Interior Designer
28 Tháng 10, 2020

How to Become an Interior Decorator
26 Tháng 10, 2020

How to Become a Landscape Designer
26 Tháng 10, 2020

Decision-making Tools and Techniques: Best List Part 2
30 Tháng 07, 2020